
The PE ratio is a multiple of critical importance. I feel it is often overlooked when making investment decisions. It is more than just a display of pricing, it can, if analysed correctly, be a glimpse into the future of the company. Let us first understand how the PE ratio works.
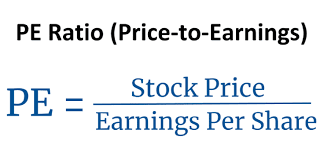
The PE ratio is among the simplest analytical multiples a stock has. It is, simply put, a stock’s price per share, divided by its earnings per share or EPS. The result is the stock’s PE ratio, or how much money an investor is currently paying for one unit currency worth of earnings for the company.
Now, the PE ratio of a standalone stock doesn’t tell you much. However, when compared with the PE ratios of its market competitors, we can understand the average price to earnings multiple in an industry, and how much specific stocks in that industry deviate from that average. This helps investors understand how fairly a stock is valued, based on its earnings, and also understand the industry average in terms of how stocks are being priced.
Now, moving away from basic concepts, based on my understanding of the market, investors have a very odd relationship with the PE ratio. To understand that, we must ask ourselves the question: what exactly does a high PE ratio mean? Simply that as an investor, I am paying a high sum of money, to gain one unit currency of earnings. Now comes the more important question: why is there a situation, wherein a stock has a high PE ratio, or in other words is overvalued when compared to its earnings?
The answer to this lies in what stock prices indicate. Stock prices are not just numbers showing whether a security is being bought or sold, rather they reflect the market’s understanding and sentiment regarding companies’ future performance and outlook. So, in essence, a high price to equity ratio underlines the fact that the market believes that said company will generate enough earnings to warrant its high price.
Now while in some cases that can be justified, one must understand that the market, in the short term, may make irrational decisions, but will always correct itself to fair value in the long run. Applying this to PE ratios, if a stock’s PE ratio is too stretched from that of its competitors, and the industry average, one of two things is certain: either the company’s earnings in the future will be as the market expected, warranting the high price, or the company fails to meet the expectations, resulting in a market correction of its price. Unfortunately, many times, it is the latter: a case where investors overlook the current earnings of a company, and end up getting caught up in mass optimism, and buying stocks that are far too overvalued in their price; overcompensating for future earnings. In several cases, even a small underachievement by a company with a high PE will cause mass investor loss of trust, and a dramatic fall in price.
Taking an example, Paypal. During July of 2021, PayPal’s stock reached an all-time high around $310 with a P/E ratio of approximately 70. This was mainly due to pandemic-driven growth, and key partnerships and services launched by the company, which, like many stocks during covid, led to a mass over-optimism in the company, and overcompensation for future growth, resulting in a very high stock price. Increasing competition, and stagnant profits led to a shift in investor mood, moving away from an overvalued price, to a dramatic fall.


Graphs from roic.ai
In a similar sense, a low PE ratio can indicate the undervaluation of a stock, as it means that an investor is having to pay a significantly low amount for a unit currency worth of earnings. A PE ratio lesser than the industry average can indicate that the market has, through current news and financial circumstances, not expected much future gains from the company. This can be taken advantage of, when fundamentally sound companies have low PE ratios.
The PE ratio, if high, can be a sign of future volatility. As an investor, it is a wise decision to focus on stocks with comparative, or in certain cases, low PE ratios in relation to the industry average.
If you liked this reading, and want to read more of our handcrafted blog posts, visit our Blog page.
Financial disclaimer: BullishBehaviour and its team members are not registered as financial advisors and hold no formal qualifications to give financial advice. Everything that is provided on this server, on the BullishBehaviour website or by BullishBehaviour and its team members is purely for educational purposes only. BullishBehaviour and its team members are not accountable or liable for any losses or damages. You are responsible for all the risks you take. Any content provided here should not be construed as financial advice.
No responses yet